31/10/2014 - Child cancer and power line corona
This news article has been revised on 1st December 2014 after extensive and helpful discussions between Dr John Swanson, Professor Mike O'Carroll and Powerwatch regarding the scientific issues. The original version is available on request. The new paper[1] from National Grid's Dr John Swanson and the team from what used to be the Oxford-based Childhood Cancer Research Group attempts to test Professor Denis Henshaw's corona-ion hypothesis. The paper really does not, in our opinion, add anything useful, despite the hard work that clearly went into this research.
This new research sets out to test the hypothesis by trying to look up-wind and downwind from powerlines to see if there are differences in childhood cancer incidence. They conclude that the new work does not prove or disprove the Henshaw hypothesis, nor does it provide any support for it.
 We at Powerwatch are not surprised by their conclusions. We claim that the work is flawed due to confounders, by uncertainties in scientific modelling and inadequate knowledge of weather patterns and aerosol science. It really stood little chance of properly judging the hypothesis. We explain our reasons below. We at Powerwatch are not surprised by their conclusions. We claim that the work is flawed due to confounders, by uncertainties in scientific modelling and inadequate knowledge of weather patterns and aerosol science. It really stood little chance of properly judging the hypothesis. We explain our reasons below.
We reported on the group's previous paper that related to this topic in our news story earlier this year. We are grateful to the authors for commenting on our atomic bomb fallout theory in this new paper. We still believe that enhancement by corona ions of radionuclides from this source could well be an explanation of the effect which these authors have shown was strongest in the 1960s and had faded by the 1990s. Their new analysis in this paper shows the effect more strongly than ever. Recent work shows that there is still, 50 years after the tests, some Strontium 90 and Caesium 137 from the bomb tests in the upper atmosphere. Their half-lives are both about 30 years, so that also fits with the plateauing of the incidence rate of childhood leukaemia that has now occurred since about the year 2000 (it rose by over 1% per year from the 1960s).
Background: The Henshaw hypothesis proposes that corona ions, charged atmospheric ions produced by high voltage overhead powerlines, attach themselves to toxic pollutants (like carcinogenic radioactive or chemical particles). When these charged particles are breathed in they are much more likely to be retained in the lung and enter the bloodstream and be distributed throughout the body. The mechanism of toxic particles carrying electric charge being more dangerous when inhaled is well documented and is not in doubt. The questions arise about how much of this goes on near to powerlines and what the likely effect on human health might be.
The analysis was carried out to see if the corona-ion model could explain the previously found associations of childhood cancer with distance from high-voltage powerlines that extended out to some 600 metres away from the power line - far too far for electric and magnetic fields from the powerline to have any effect, as in most cases these fall off to low levels within 100 metres or less. The team used English and Welsh data with the birth address being used for the children. In their previous (Bunch) paper they included data for Scotland. Omitting Scotland reduced the case numbers by about 2000 (about 14%) but will probably not change the results much.
Our main reasons for dismissing the analysis
- The authors assume in their analysis that corona ion emissions arise chiefly from the cable-arrangement and voltage of the powerlines. However they also admit that the main cause of such emissions arises from corrosion of the cables by pollution which, for any given line, is unknown and cannot be modelled meaningfully.
- The authors point to a decrease in recent decades of the large-size (PM10 and PM2.5) particulate air pollutants, but fail to discuss a larger increase in "ultrafine" particles (100-200 nanometres in size), mostly resulting from the 1992 mandatory introduction of vehicle exhaust catalytic converters. Such ultrafine particulates travel large distances from their source, even crossing international boundaries. As a result, it is misleading of the authors to suggest that exposure to total air pollution both near and away from powerlines has decreased in recent decades. Rather the overall exposure of children across the country has actually increased with large numbers of smaller particles that can easily enter the bloodstream - this could be a significant confounder as it changes the exposure of the controls - it should have been discussed.
- The authors claim to consider wind direction in carrying corona ions downwind of powerlines. However, wind direction is very variable and all locations will have winds at times from other directions including opposite to their assumed one. They have averaged annual data for a restricted time-period for just 8 weather stations in the whole of England and Wales.
An important review of wind variability was published by Alan Lapworth and James McGregor in 2008 [2]. This shows that even for an almost ideal flat land Met Office weather station site (Cardington, East Midlands) the wind direction has enormous variability over the year. Even if (as there) there is a predominant direction, who is to say that on the day the critical toxic particle is being inhaled that the wind is not blowing in the opposite direction?
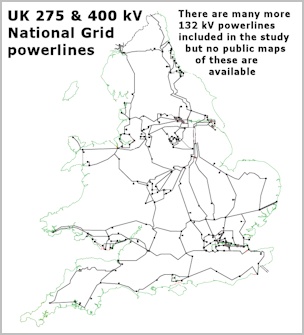
They also point out: "An even greater effect, however, is caused by relatively local topographic effects." These include local hills, valleys, etc. This will also be the case in urban areas which many of the 132 kV lines cross, with buildings and streets considerably diverting the air flow.
It is important to note that Westerly winds that originate over the Atlantic, are largely devoid of pollutants, whereas Easterly winds can bring pollutants from Europe as illustrated in the smog event predominant in the South east of England in April 2014. This could have also affected the results.
- The inclusion of 132 kV lines is important as they are significant sources of corona ions. However, many are over urban areas where air-flow resistance by buildings and convection currents are very complex and will greatly distort the diffusion patterns from a simple prevailing wind model.
- The use of the 1/r factor in the modelling is debatable. We originally wrote that the inclusion 1/r factor was an error. We now understand that there are alternative ways of modelling corona from power lines. Using the model chosen by the original authors, the 1/r factor was in fact correct. There is an alternative model where 1/r is not needed. We prefer that model as it is simpler and does not rely on discretisation of the line with consequent errors; the original authors preferred their model because it captures real-life geometries of power lines better; but at the end of the day, they are both severe approximations to the reality of corona exposure.
Overall, we agree with the authors who conclude that the new work does not prove or disprove the Henshaw hypothesis. The work was done and it was reasonable to publish it. We hope that it is not cited by others in the future as if it did disprove the Henshaw corona-ion hypothesis.
Links
1/. J Swanson et al 2014, Childhood cancer and exposure to corona ions from power lines: an epidemiological test, J. Radiol. Prot. 34 873.
2/. A Lapworth & J McGregor 2008, Seasonal variation of the prevailing wind direction in Britain, Weather, 2008, Vol.63, No.12 online free access pdf
|